This page shows a body of work produced and reinterpreted as part of a residency with Lumen, a space-arts collective based in Bethnal Green. The residency took place in Atina, Italy, and includes exhibitions at the Chiesa San Francesco as part of the Assumption of Mary festival in Atina (August 2017), and at the Crypt Gallery in Euston, London (January 2018).
Through the residency I experimented with using the sun to compose artwork, including solar printing with cyanotypes and lumen prints. The Mediterranean was in the midst of heatwaves and droughts, with Atina plagued by forest fires. There seemed a fateful convergence of subject and material. I set about developing data visualisations of Mediterranean environmental change using the sun’s energy as a variable in the composition of the work.
This body of work includes 2D cyanotype maps. Cyanotypes are alternative photography processes, first developed by the astronomer John Herschel in the 19th Century. The bottle green cyanotype liquid is painted onto a ground, such as paper, and becomes bright blue when exposed in the sun; unexposed cyanotype is washed away to reveal the ground. I used this technique to produce a solar exposed map of environmental change in the Mediterranean. I split a map of the basin into 96 squares or (data pixels), each exposed to the sun for different times depending on the environmental change predicted by scientists. Some data squares, generally in the north, are completely underexposed and invisible. Others, especially in the Mediterranean, are much deeper blue in colour, literally exposed to the sun’s rays for too long. Another 2D work shows the same map of climate change in Italy exposed every hour through a day for 500 seconds, the length of time it takes for the sun’s rays to reach the earth. This work is a different take on a data visualiation. Whilst the core image is a climate data map, the strength of the image is directly affected by some of the data in question, in this case the strength of the sun at different times of the day. There’s almost a circularity to the concept of depicting information about the weather using the sun as a part of the methodology. The climate change data is sourced from www.climatewizard.org.
The work for the Chiesa San Francesco was designed around the unique topography of the church. I used water risk data from the World Resource’s Institute’s interactive Aqueduct mapping tool to produce 24 glass map tiles of the Mediterranean, arranged on the church’s votive candle stand. I developed a special method to solar expose cyanotype maps on glass. Candles illuminate the glass tiles from below, imbuing the piece with a sense of atmosphere, heat and viscosity. Periodically a candle would snuff out, emitting reams of smoke. Individuals made offerings to pay for new candles to replace those who had expired, to carry on illuminating the map of Europe.
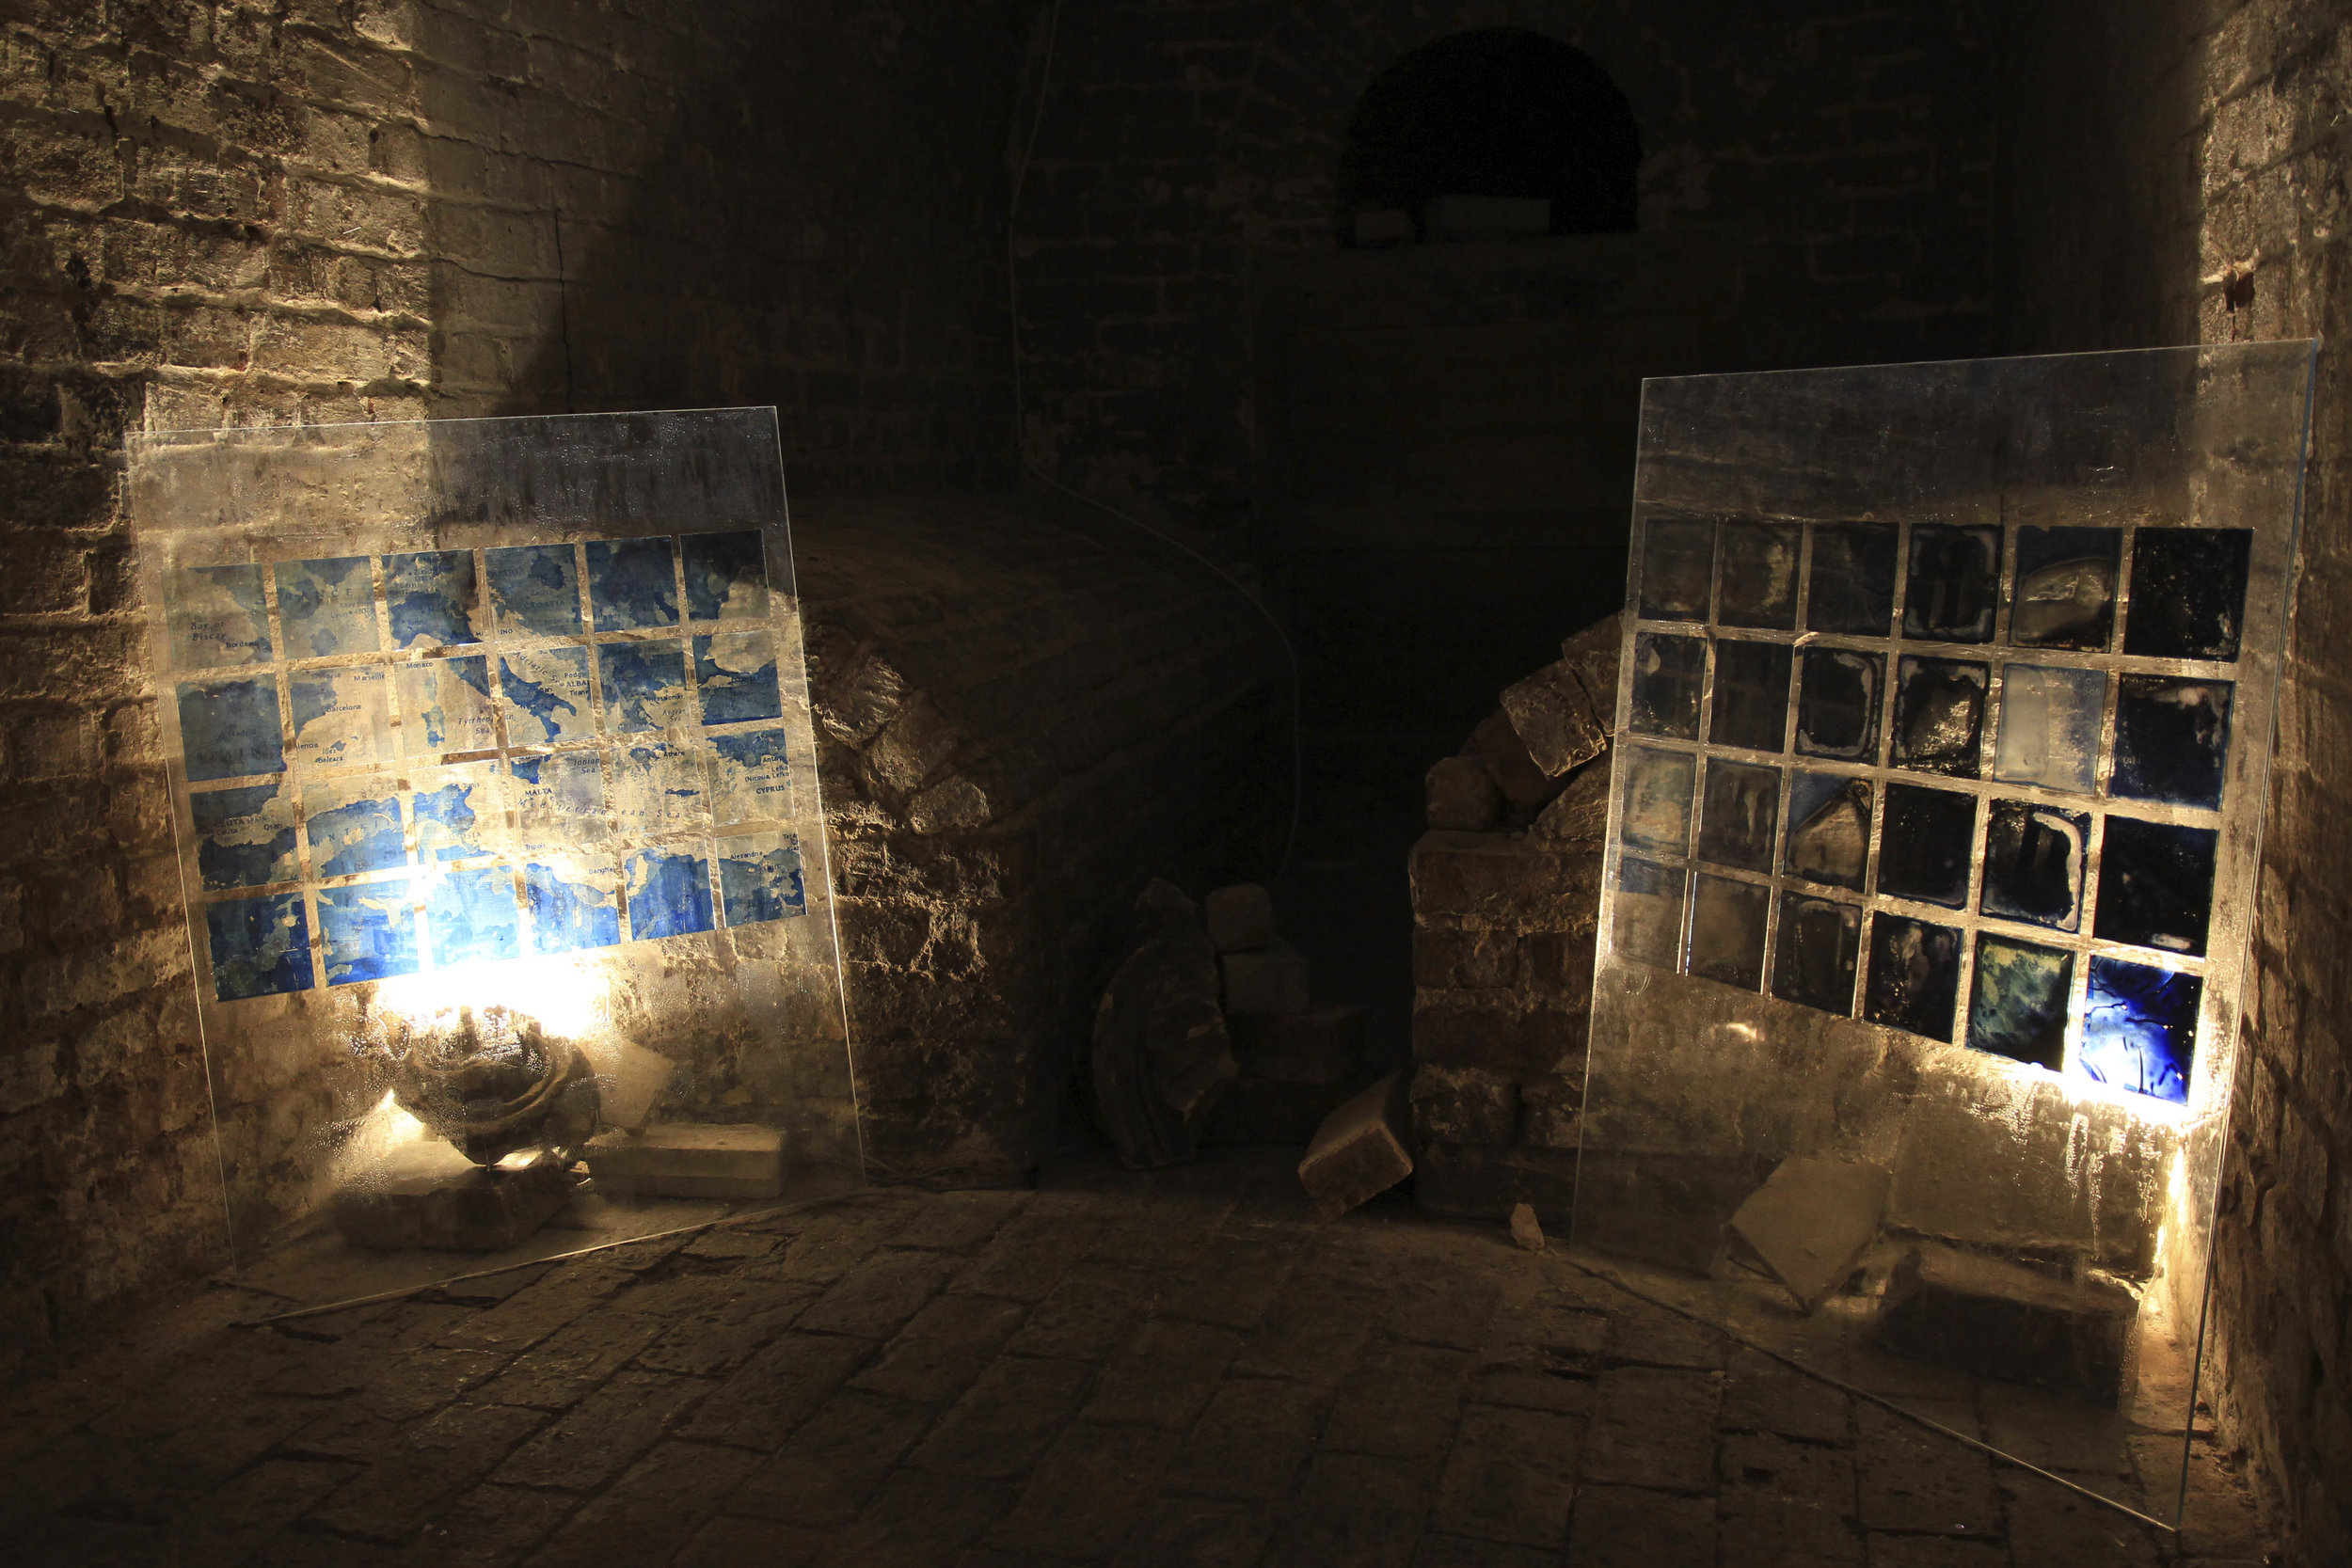
These themes were further developed for the work in the Crypt Gallery, which includes two panels of 24 glass tiles. On one panel I used the same 24 glass tiles of water risk as in the Chiesa San Francesco, positioned on clear glass to allow the surfaces of the crypt to come through the artwork. In producing the 24 cyanotype glass tiles in Italy, I made a number of mistakes. Some of the tiles were baked in the hot sun for too long, becoming crusty and losing the data from the maps. Some are completely washed away. Unexpectedly this imagery gives a sense of a political and ecological scenario where science about climate change is ignored. This is the material which makes up the second glass panel. This work, comprising the two panels, is called European Scenarios.


